| SUPERANNUATION PERFORMANCE - March 2018
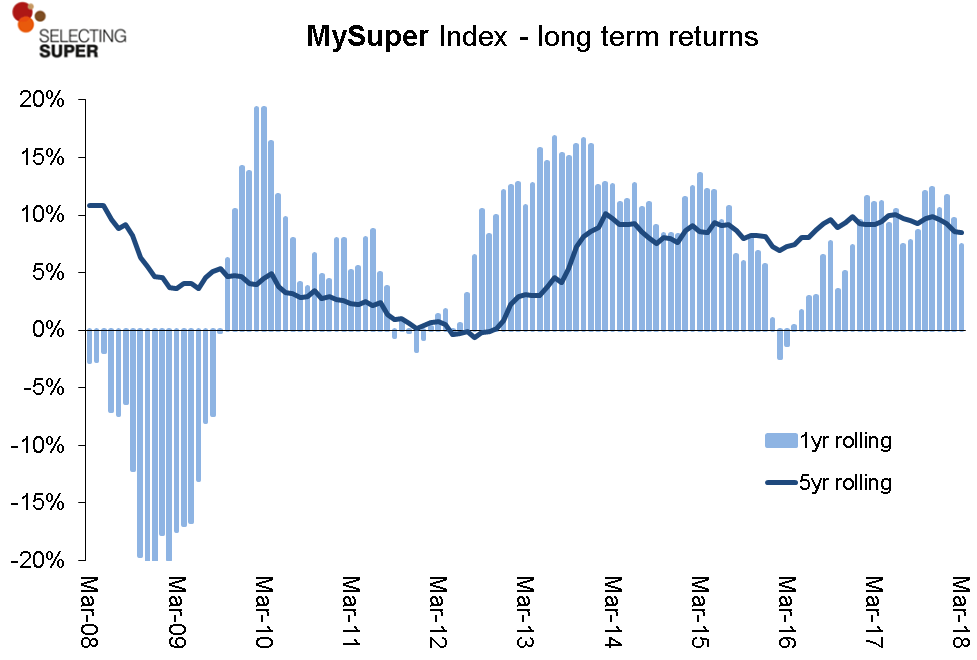
MySuper default superannuation products delivered an average 7.4% into their members' accounts for the 12 months to end March 2018.
This is the second consecutive month where rolling 12 month returns have fallen. At the end February it was 9.6% and at the end of January it was 11.7%. This compares to June 2017 when the average MySuper default option delivered 10.4%.
MySuper default investment options are the flagship segment of Australia's superannuation system holding an estimated $635 billion on behalf of the two thirds of Australian workers who use these superannuation products..
Pushing investment returns down were relatively large falls in returns from Australian and international equities in the month of March - the S&P/ASX 200 Accumulation Index fell nearly 4 percentage points while the MSCI All Countries Index fell 2.2% in local currency terms and fell 0.5% in Australian dollar terms (most super funds have around half their international equities exposure hedged to Australian dollars).
But offsetting these poor returns from equities, real assets in the form of property and infrastructure both recorded positive results in the month. Listed international infrastructure (hedged to Australian dollars) returned 1.8% in March.
Fixed income, i.e., bonds, albeit with the exception of high yield, did very well in March with returns of around 1%. Note that these bond returns reflect the capital returns on their portfolio value rather than interest rate yields paid on investment such as cash term deposits.
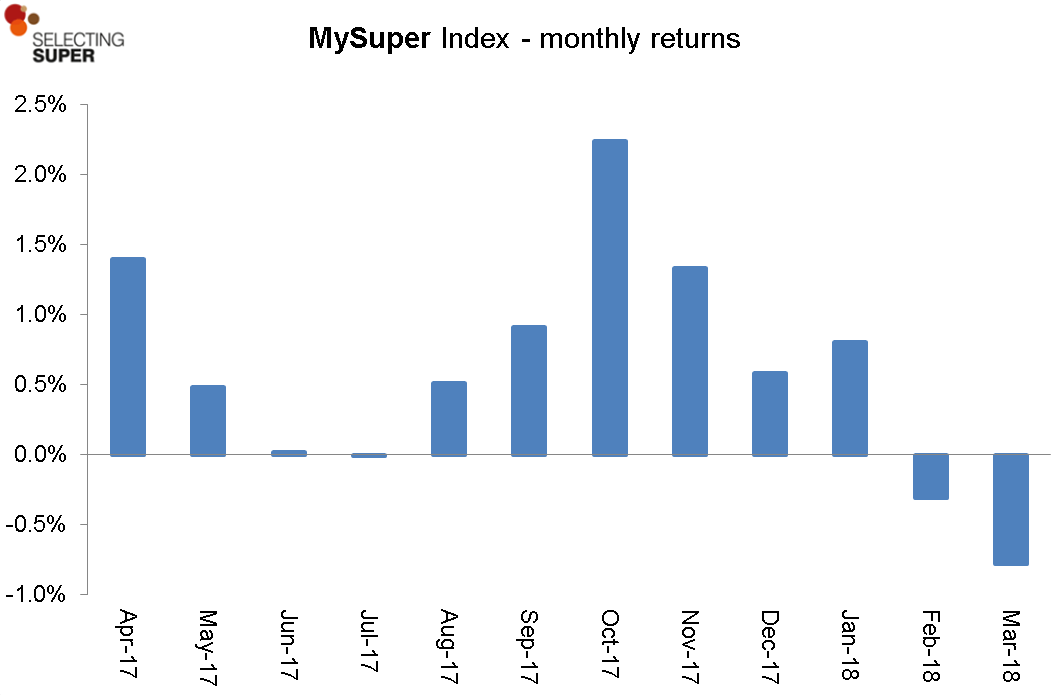
As a result of these asset class effects, the Rainmaker SelectingSuper workplace Default/MySuper Index showed a negative monthly return of 0.8% in the month of March.
In February the index returned an average -0.3% compared to +0.8% in January. In the past 12 months the index delivered a positive outcome 10 times.
Stephen Fay, head of superannuation research at Rainmaker Information, said: "Since equities is the largest component of most super funds they have an oversize impact on performance. Within equities, the other major factor is the asset allocation split between Australian and overseas equities, and whether the overseas equities component is currency hedged or not."
"These choices have had a particular impact in the past 12 months. Australian equities returned 2.5% over this period versus 10.8% for currency hedged overseas equities. Unhedged overseas equities performed even better, returning 13.9%."
"Fixed interest is often seen as a portfolio diversifier," he said. "But in this case both Australian and international fixed interest had modest returns over 12 months of 3.3% and 2.9% respectively."
Adding to this, "Australian listed property remains disappointing, returning -0.8% over 12 months. Direct property, generally less volatile on a month to month basis since returns are estimated from professional valuations, had stronger returns over both the month of March (nearly 2%) and over 12 months (nearly 16%), based on the Financial Standard Direct Property Index."
Despite recent short term volatility, performance over multi-year time periods continues to benefit from the positive impact of the generally high returns since 2012. Average five year default super returns are a healthy 8.5%pa thanks largely to high returns from both Australian and international equities.
|